Project Overview
This project consists of two interconnected Tableau dashboards designed to provide comprehensive business intelligence on sales performance and customer behavior. Built following a structured tutorial, this project demonstrates fundamental and advanced Tableau techniques essential for creating professional, interactive dashboards.
Key Metrics Analyzed
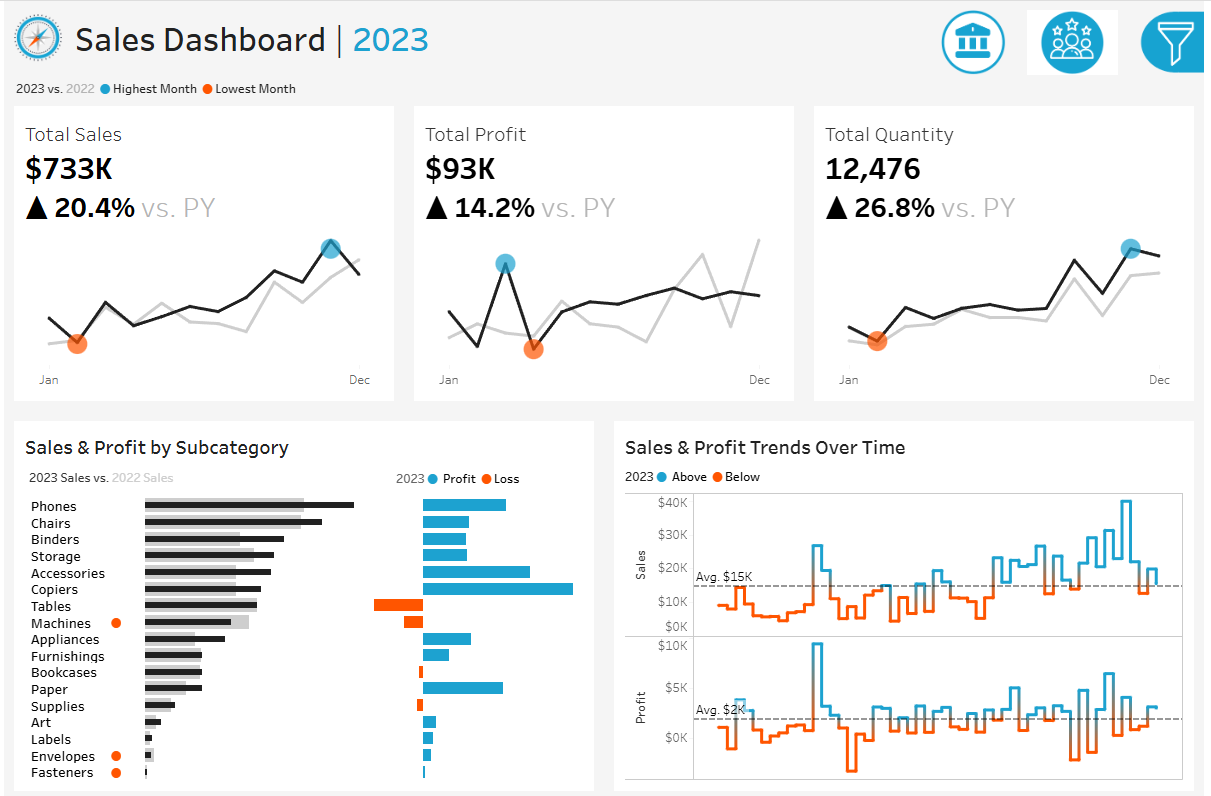
- Sales Dashboard: $733K total sales (20.4% YoY growth), $93K profit (14.2% YoY growth), 12,476 units sold
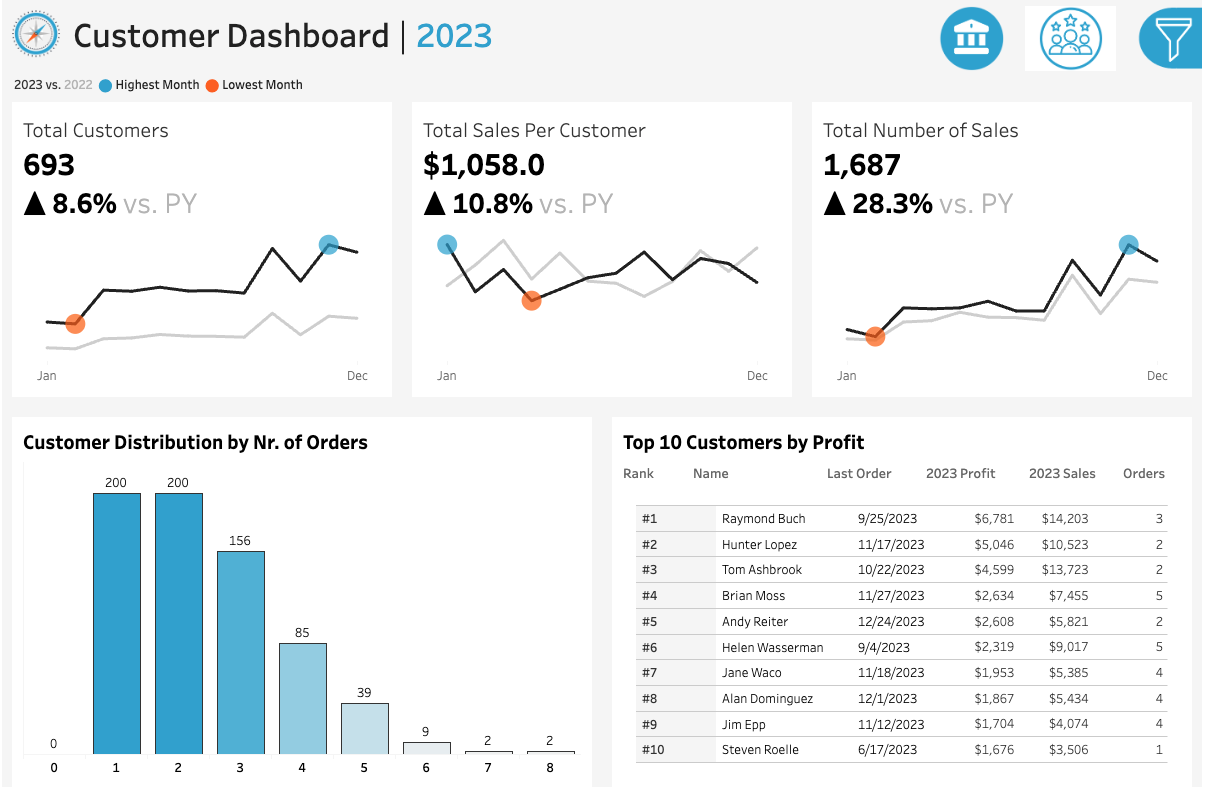
- Customer Dashboard: 693 customers (8.6% growth), $1,058 sales per customer (10.8% growth), 1,687 total orders
Technical Skills Demonstrated
Dashboard Design & UX
- KPI Cards with Sparklines: Created executive summary cards showing key metrics with trend indicators and YoY comparisons
- Interactive Filtering: Implemented show/hide filter panel with toggle button for clean UX when filters aren't needed
- Dashboard Navigation: Connected multiple dashboards with navigation buttons for seamless user experience
- Responsive Layout: Designed dashboard grid system that maintains readability and functionality
Data Visualization Techniques
- Chart Type Selection: Applied appropriate visualizations for different business questions (bar charts for categorical comparison, line charts for trends, tables for detailed rankings)
- Dual-Axis Charts: Combined multiple chart types to show profit/loss trends with overlapping time series
- Color Strategy: Used consistent color coding (2023 vs 2022) and conditional formatting to highlight insights
- Reference Lines: Added context with highest/lowest month indicators and comparison baselines
Tableau Technical Skills
- Calculated Fields: Built YoY growth calculations, profit margins, and customer metrics
- Parameters: Created year selection parameters for dynamic filtering
- AVG(0) Technique: Used dummy fields to create custom layouts and positioning in dashboards
- Table Calculations: Implemented ranking, running totals, and percentage of total calculations
- Tooltip Customization: Enhanced user experience with detailed, formatted tooltips
Business Analysis
- Identified top-performing product subcategories (Chairs, Phones) driving sales growth
- Analyzed customer segmentation by order frequency and profitability
- Tracked seasonal trends and monthly performance patterns
- Highlighted underperforming categories requiring strategic attention
Learning & Development
This project was completed following a comprehensive Tableau tutorial, demonstrating my ability to:
- Learn new technical skills independently through structured online resources
- Apply best practices in dashboard design and data visualization
- Understand when and how to use specific chart types to answer business questions
- Create professional, stakeholder-ready visualizations
- Implement advanced Tableau techniques (parameters, calculated fields, dual-axis charts)
Tutorial Credit: This project followed the excellent instruction from [Tutorial Creator Name/YouTube Channel]. The tutorial provided structured guidance on Tableau best practices, dashboard design principles, and advanced visualization techniques.
Tools & Technologies
- Tableau Desktop: Dashboard creation, calculated fields, parameters, and interactive design
- Tableau Public: Publishing and sharing interactive dashboards
- Data Preparation: Data cleaning and transformation for dashboard-ready datasets
Key Takeaways
This project reinforced several critical concepts in business intelligence and data visualization:
- Dashboard Design is User-Centric: The best dashboards balance information density with clarity, providing filters and navigation without overwhelming users
- Context Matters: YoY comparisons, sparklines, and reference points help stakeholders understand not just what the numbers are, but what they mean
- Technical Skills Enable Better Analysis: Advanced Tableau techniques like dual-axis charts and calculated fields unlock more sophisticated analytical capabilities
- Iteration Improves Quality: Following structured tutorials helps build foundational skills that can be applied to original projects