Project Overview
Interactive Excel dashboard analyzing budget vs. actual performance for Bella Vista Property Owners Association. Built for an academic assignment following a professional CFO tutorial, this project demonstrates proficiency in Excel's advanced features including dynamic formulas, conditional formatting, data visualization, and professional financial reporting standards.
Key Metrics Analyzed
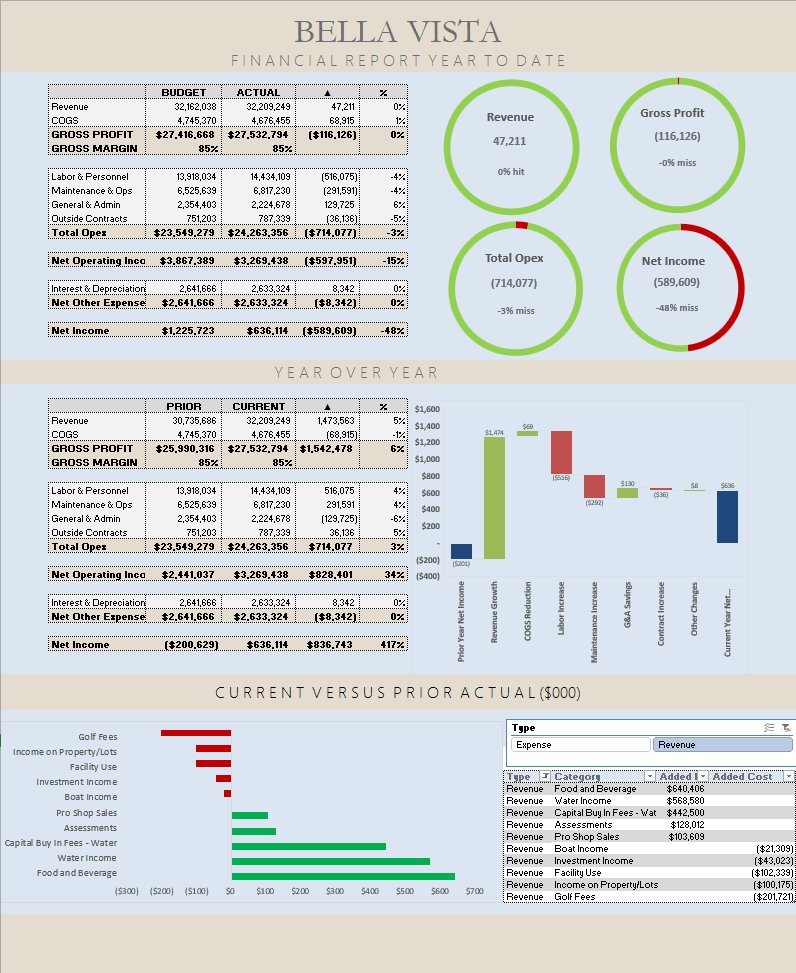
- Critical Performance Issue: $589K net income loss vs. $636K budgeted profit—a $1.2M swing requiring immediate attention
- Revenue Performance: $47.2M actual revenue (0% variance from budget), tracking 9 revenue streams
- Operating Loss: $714K net operating income miss (-16% variance), identifying specific underperforming categories
- Year-over-Year Growth: 117% net income improvement from prior year, showing progress despite budget miss
Technical Skills Demonstrated
Dashboard Design & Layout
- Visual KPI Indicators: Donut charts showing performance against targets with color-coded status (green for on-target, red for misses)
- Multi-Section Layout: Year-to-date summary at top, year-over-year comparison in middle, detailed category breakdown at bottom
- Professional Formatting: Clean, scannable design with branded header and consistent visual hierarchy
- Chart Integration: Waterfall charts for YoY analysis, horizontal bar charts for category comparisons
Excel Technical Skills
- Multi-Sheet Architecture: 8 worksheets including raw data tables, cleaned data sources, calculation tables, and presentation dashboard
- Dynamic Formulas: Variance calculations, percentage calculations, and cross-sheet references avoiding hardcoded values
- Data Normalization: Structured data tables (Actual, Budget, Combined) feeding dashboard calculations
- Conditional Formatting: Automatic color-coding based on performance thresholds
- Professional Number Formatting: Currency formatting ($#,##0), percentages (0%), negative values in parentheses
Financial Analysis Techniques
- Variance Analysis: Budget vs. actual comparison across all revenue and expense categories with dollar and percentage variance
- YTD Performance Tracking: Year-to-date actuals compared against budget and prior year
- Gross Margin Analysis: 88% gross margin tracking with comparison to budget
- Expense Category Analysis: Labor & Personnel, Maintenance & Operations, General & Admin, Outside Contracts breakdown
Data Visualization
- KPI Donut Charts: Four key metrics (Revenue, Gross Profit, Total Opex, Net Income) with visual performance indicators
- Waterfall Charts: Year-over-year category changes showing positive and negative contributions
- Horizontal Bar Charts: Current vs. prior year comparison for revenue and expense categories
- Summary Tables: Detailed line-item breakdown with budget, actual, variance, and YoY data
Workbook Structure
The dashboard uses a layered architecture separating data, calculations, and presentation:
Data Layer
- Full: Complete MTD and YTD data with all columns (Actual, Budget, Variance, Prior Year)
- YTD_Full: Year-to-date focused dataset
- Actual (YTD): Normalized actual values table
- Budget (YTD): Normalized budget values table
Calculation Layer
- Combined_YTD: Merged actual and budget data for variance analysis
- Combined_YoY: Year-over-year comparison calculations
- Figure Tables: Summary calculations feeding dashboard visuals
Presentation Layer
- Dashboard: Executive summary with KPIs, charts, and detailed breakdowns
Business Insights
The dashboard immediately highlights a critical financial issue requiring executive attention:
- Major Budget Miss: $589K net loss vs. $636K budgeted profit represents a $1.2M swing from expectations—the primary story this dashboard tells
- Revenue Meets Target: Despite revenue performing on-budget ($47.2M), the income miss indicates an expense control problem, not a sales problem
- Golf Operations Underperformance: $370K revenue shortfall in golf fees suggests seasonal or competitive challenges
- Operating Expense Concerns: $714K operating income miss (-16% variance) points to cost overruns requiring category-level investigation
- Growth Areas: Food & Beverage up $640K YoY, RV Income up $98K YoY show some operational strengths
- Declining Categories: Golf Fees down $202K YoY, Facility Use down $102K YoY requiring strategic review
Learning & Development
This project was completed following a comprehensive Excel financial dashboard tutorial, demonstrating my ability to:
- Learn professional financial modeling techniques through structured online resources
- Apply CFO-level reporting standards to create stakeholder-ready deliverables
- Understand variance analysis and financial performance metrics
- Build dynamic Excel models using formulas rather than hardcoded values
- Create visually compelling dashboards that communicate complex financial data clearly
Tutorial Credit: This project followed the excellent instruction from Josh Aharonoff (Your CFO Guy) on YouTube. The tutorial provided structured guidance on budget vs. actual dashboard design, variance analysis best practices, and professional financial reporting standards.
Tools & Technologies
- Microsoft Excel: Dashboard creation, advanced formulas, data modeling, and chart design
- Financial Formulas: Variance calculations, percentage calculations, cross-sheet references
- Data Visualization: Donut charts, waterfall charts, horizontal bar charts
- Professional Formatting: Conditional formatting, number formatting, color-coding standards
Key Takeaways
This project reinforced several critical concepts in financial reporting and Excel modeling:
- Executive Dashboards Prioritize Clarity: Visual indicators and summary metrics enable quick decision-making, while detailed tables provide drill-down capability
- Dynamic Models Beat Static Reports: Using formulas instead of hardcoded values ensures the dashboard remains accurate as data updates
- Variance Analysis Drives Action: Highlighting budget misses and year-over-year changes helps stakeholders focus on areas requiring attention
- Professional Standards Matter: Consistent formatting, proper number display, and clear labeling make financial reports credible and easy to interpret
- Layered Architecture Enables Maintenance: Separating data, calculations, and presentation makes the workbook easier to update and debug
Explore More Projects
Interested in seeing more of my work? Visit my Projects Hub