Project
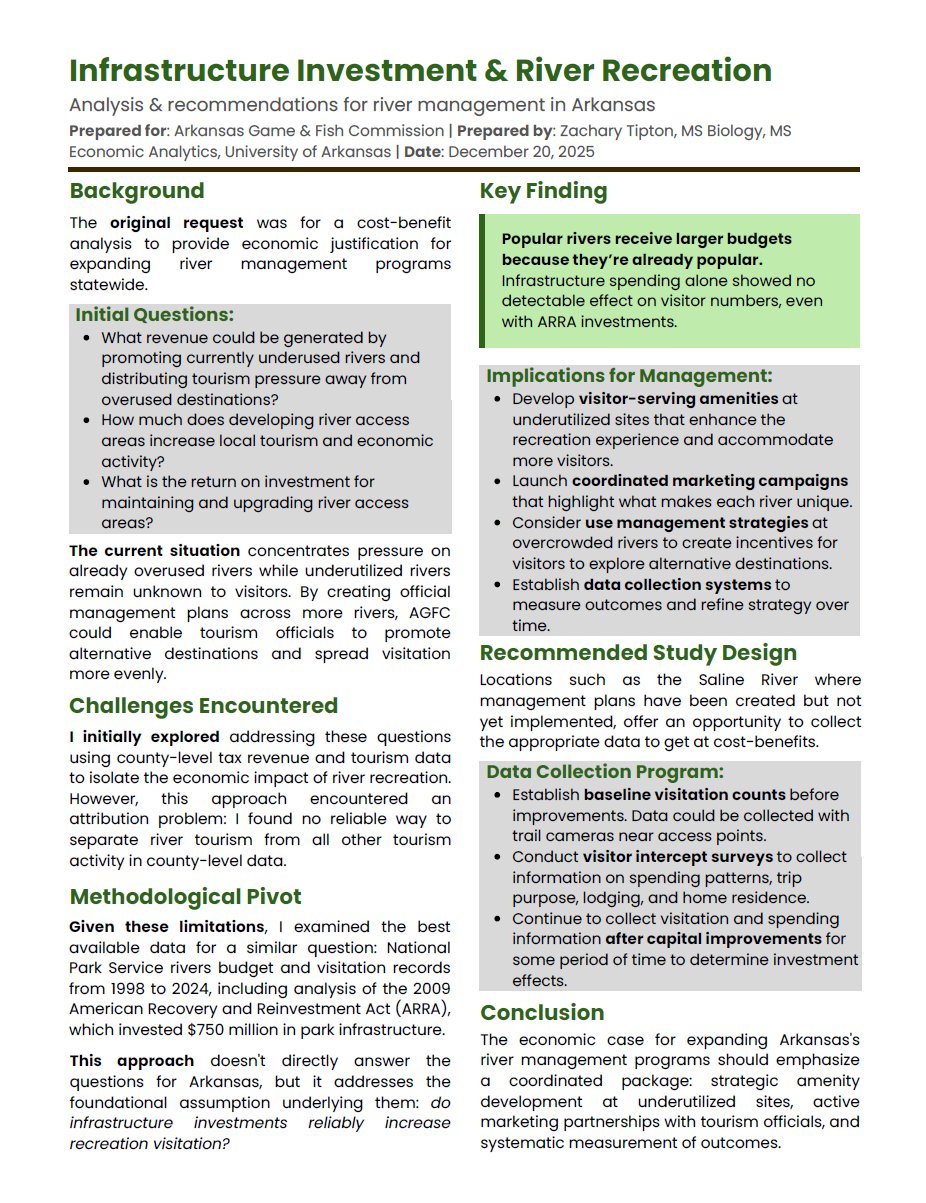
Arkansas Game & Fish Commission (AGFC) requested economic analysis to justify expanding river management programs statewide. The original questions focused on revenue generation potential, local economic impacts of developing river access areas, and return on investment for infrastructure improvements.
Initial exploration using county-level tax revenue and tourism data encountered a fundamental attribution problem: no reliable way to isolate river recreation impacts from all other tourism activity. This led to a methodological pivot examining the best available comparable data—National Park Service rivers with 26 years of budget and visitation records, including the 2009 American Recovery and Reinvestment Act (ARRA) which invested $750 million in park infrastructure.
Impact
The analysis found no causal relationship between capital spending and visitor numbers across 10 NPS river units from 1998-2024, even with ARRA investments ranging from -$14,000 to $256,000. This challenges the foundational assumption underlying infrastructure-led tourism growth strategies.
Key Policy Implications:
- Avoided Ineffective Spending: Findings suggest infrastructure alone doesn't drive visitation, potentially saving AGFC from costly investments with uncertain returns
- Alternative Strategy Recommended: Proposed coordinated approach emphasizing visitor amenities at underutilized sites, active marketing campaigns highlighting unique river characteristics, and systematic data collection to measure outcomes
- Study Design Provided: Detailed recommendations for collecting baseline visitation counts, conducting visitor surveys, and measuring investment effects over time—creating evidence base for future decisions
- Stakeholder Translation: Complex econometric findings distilled into actionable one-page summary for non-technical decision-makers
Tools & Methods
- Python: pandas for data manipulation, statsmodels for econometric analysis, matplotlib/seaborn for visualization
- Causal Inference Techniques: Panel data models with fixed effects, difference-in-differences analysis, event study specification, parallel trends testing
- Econometric Methods: Two-way fixed effects controlling for river-specific characteristics and common time shocks, lagged treatment structures (1, 3, 5-year lags), continuous treatment DiD exploiting ARRA natural experiment
- Data Sources: National Park Service budget justification documents (1998-2024), recreational visitor counts by river unit
- Statistical Software: Clustered standard errors at river level, robust inference accounting for serial correlation
Technical Skills Demonstrated
Causal Inference & Econometrics
- Identification Strategies: Addressed simultaneity bias (popular rivers receive more funding) using fixed effects to control for time-invariant confounders
- Natural Experiments: Exploited ARRA stimulus as exogenous shock providing quasi-random variation in infrastructure funding
- Event Study Design: Tested parallel trends assumption with year-by-year coefficient estimates, verifying pre-treatment periods showed no differential trends
- Treatment Effect Heterogeneity: Examined both continuous treatment (funding intensity) and quartile-based specifications to detect non-linear effects
- Lagged Effects: Tested infrastructure impacts at 1, 3, and 5-year lags to account for delayed construction and visitor response
Data Analysis & Manipulation
- Panel Data Construction: Assembled 26-year longitudinal dataset from 260+ PDF budget documents, creating river-year observations
- Variance Decomposition: Separated between-river variation (R² = 0.804) from within-river variation (R² = 0.114) to isolate causal effects
- Treatment Variable Engineering: Constructed ARRA intensity measure as 2009-2008 budget change, normalized by $100,000 for interpretability
- Missing Data Handling: Limited analysis to 10 rivers with complete 26-year records to avoid bias from partial coverage
Statistical Inference & Robustness
- Clustered Standard Errors: Accounted for serial correlation within rivers over time, providing conservative inference
- Multiple Specifications: Pooled OLS baseline, river fixed effects, two-way fixed effects, lagged models, and DiD—consistent null findings across all
- Sensitivity Analysis: Tested alternative lag structures, quartile vs. continuous treatment, parallel trends validation
- Power Considerations: Acknowledged limited statistical power due to small sample (N=10 rivers) and modest treatment intensity ($119K mean ARRA increase)
Research Design & Problem Solving
- Methodological Pivot: Recognized attribution problem in original approach, identified alternative data source addressing same theoretical question
- Limitations Transparency: Clearly documented Great Recession confounding, maintenance vs. amenity distinction, selection bias concerns, external validity constraints
- Alternative Mechanisms: Acknowledged infrastructure might affect willingness-to-pay, trip length, or spending without increasing visitor counts
- Future Research Roadmap: Proposed data collection program enabling causal inference in Arkansas context
Communication & Stakeholder Engagement
- Dual-Audience Approach: Technical report for academic rigor, one-page summary for policy actionability
- Visual Evidence: Scatter plots showing correlation vs. causation, variance decomposition charts, event study coefficients with confidence intervals
- Actionable Recommendations: Translated null findings into concrete policy alternatives rather than just reporting "no effect"
- Transparent Uncertainty: Communicated what the analysis could and couldn't answer, guiding future data collection
Key Findings
Main Result: No Causal Effect of Infrastructure on Visitation
Across all specifications—pooled OLS, river fixed effects, two-way fixed effects, lagged models, and difference-in-differences—there was no evidence that capital budget increases caused higher recreational visitation. While pooled correlations showed strong positive relationships (R² = 0.804), this reflected between-river differences (popular rivers receive larger budgets) rather than within-river causal effects.
Fixed Effects Analysis
- Pooled OLS: Each additional dollar in capital budget associated with 0.20 additional visitors (highly significant, p < 0.001)
- River Fixed Effects: Coefficient dropped to 0.08 and became statistically insignificant (p = 0.338), showing correlation was driven by permanent river characteristics
- Two-Way Fixed Effects: Coefficient remained insignificant (0.14, p = 0.339) after controlling for common time shocks
ARRA Natural Experiment
- Parallel Trends Validated: Pre-2009 event study coefficients clustered near zero with no significant deviations, supporting causal identification
- No Post-Treatment Effects: Post-2009 coefficients remained near zero without systematic upward movement despite $119K average funding increases
- Quartile Analysis: Only statistically significant coefficient was negative (Q3: -172,619 visitors, p = 0.056), contradicting infrastructure impact hypothesis
Lagged Effects Testing
Infrastructure effects might emerge with time lags as construction completes and visitors discover improvements. Tested 1-year, 3-year, and 5-year lags—all coefficients remained statistically insignificant with confidence intervals encompassing zero at every horizon.
Methodological Approach
Research Question Evolution
AGFC initially requested analysis of how developing river access areas increases local tourism and economic activity. County-level data proved inadequate for causal inference due to inability to separate river recreation from other tourism. The analysis pivoted to a foundational question: does infrastructure investment reliably increase recreation visitation at all?
Identification Strategy
Simple correlations between budgets and visitation suffer from omitted variable bias—rivers with superior natural amenities, better locations, or historical popularity receive both higher funding and higher visitation independent of infrastructure effects. Three strategies addressed this:
- Panel Fixed Effects: Control for time-invariant river characteristics (natural beauty, location, size) using each river as its own control
- Two-Way Fixed Effects: Additionally control for common time shocks (recession, gas prices, tourism trends) affecting all rivers
- Natural Experiment: Exploit ARRA stimulus providing quasi-random variation in funding intensity across rivers
Data Structure
Panel dataset spanning 10 National Park Service river units observed annually from 1998-2024 (N = 258 river-year observations). Selected rivers share similar designations, are located in contiguous U.S., and rely primarily on congressional appropriations for funding consistency.
Statistical Models
Estimated five core specifications:
- Pooled OLS establishing baseline correlation
- River fixed effects controlling for permanent differences
- Two-way fixed effects adding year controls
- Lagged treatment models testing delayed effects
- Continuous treatment difference-in-differences exploiting ARRA
Limitations & Future Research
Study Limitations
- Great Recession Confounding: ARRA implementation coincided with 2008-2009 recession, potentially overwhelming infrastructure effects with negative demand shocks
- Maintenance vs. Amenities: ARRA prioritized "deferred maintenance" and repairs rather than capacity-expanding amenities that might increase visitation
- Limited Treatment Intensity: Average $119K funding increases insufficient for transformational projects (boat ramps cost $100K-$300K, visitor centers $1M-$3M)
- Small Sample Size: N=10 rivers limits statistical power to detect small effects
- External Validity: NPS river units are larger and more established than typical state/local river access areas
Recommended Study Design for Arkansas
The analysis concluded with specific recommendations for AGFC to collect data enabling causal inference:
- Baseline Measurement: Establish pre-improvement visitation counts using trail cameras at access points
- Visitor Surveys: Conduct intercept surveys collecting spending patterns, trip purpose, lodging, home residence
- Natural Experiment: Leverage sites like Saline River where management plans exist but aren't yet implemented
- Longitudinal Tracking: Continue data collection post-improvement to measure treatment effects
Policy Recommendations for AGFC
Based on findings that infrastructure alone doesn't reliably increase visitation, recommended a coordinated package strategy:
Strategic Amenity Development
Prioritize visitor-serving amenities at underutilized rivers that enhance recreation experience and accommodate higher capacity—not just maintenance of existing facilities at popular destinations.
Active Marketing Campaigns
Partner with tourism officials to promote alternative destinations, highlighting what makes each river unique. Current situation concentrates pressure on overused rivers while underutilized rivers remain unknown to visitors.
Use Management at Crowded Sites
Consider strategies creating incentives for visitors to explore alternative destinations, distributing tourism pressure more evenly across the state's river system.
Systematic Outcome Measurement
Establish data collection systems enabling evidence-based decision making rather than assuming infrastructure automatically generates returns. The lack of baseline data in Arkansas prevents definitive cost-benefit analysis.
Tools & Technologies
- Python: pandas (data manipulation), statsmodels (econometric models), matplotlib/seaborn (visualization)
- Econometric Methods: Fixed effects panel models, difference-in-differences, event studies, clustered standard errors
- Data Sources: National Park Service budget justification documents, NPS visitor statistics database
- Statistical Software: Two-way fixed effects regression, lagged dependent variables, robust inference
- Communication Tools: Technical report writing, stakeholder summaries, data visualization
Key Takeaways
This project demonstrates several critical principles in applied econometric analysis and policy research:
- Correlation ≠ Causation: Strong cross-sectional correlations (R² = 0.804) disappeared once permanent differences were controlled for—popular rivers receive larger budgets because they're already popular, not vice versa
- Identification Requires Careful Design: Simple regressions mislead; causal inference demands strategies controlling for confounders (fixed effects, natural experiments, event studies)
- Null Results Are Results: Finding "no effect" provides valuable policy guidance—infrastructure spending may not be the most effective tool for increasing recreation visitation
- Methodological Flexibility: When initial data sources prove inadequate (county tax records), pivot to alternative approaches addressing the same theoretical question
- Stakeholder Translation: Technical econometric findings must be distilled into actionable recommendations for non-technical decision-makers
- Transparent Limitations: Acknowledging what analysis cannot answer (Arkansas-specific impacts) guides future data collection and research